Penn Medicine BioBank Allele Frequency Browser,
https://pmbb.med.upenn.edu/biobank/allele-frequency/
The Penn Medicine BioBank (PMBB) is a research program that recruits participants throughout the University of Pennsylvania Health System (5.7 million outpatient visits in the fiscal year 2018) by enrolling at the time of outpatient visits. Patients participate by completing a questionnaire, donating a blood sample, and allowing researchers access to their Electronic Health Record (EHR) information. The PMBB has recruited ~60,000 participants to date. Nearly 25% of PMBB participants (n ~15,000) are of African ancestry, consistent with the greater Philadelphia catchment area, making the PMBB one of the largest single institutional academic biobanks of African ancestry individuals in the country. Approximately 20,000 of these participants have already been genotyped (imputed to 1KG Phase3 dataset using Michigan Imputation Server) and 12,000 have whole exome sequence data. These are data from the PMBB-Release-2017.
Penn Medicine BioBank Team:
Regeneron Genetics Center
The genetic data included in the PMBB allele frequency browser are in genome build Genome Reference Consortium Human Build 37 (GRCh37), also known as hg19.
We derive the clinical information about the PMBB participants from the Electronic Health Record (EHR). The EHR at Penn Medicine is based in Epic and is used by all Penn Medicine clinicians with consistent clinical definitions, formularies, clinical decision support, and other features. PennChart, the branded Epic product, now supports all 2,000 physicians practicing throughout the Penn health system. Penn Data Store (PDS), Penn Medicine’s clinical data warehouse, contains over 6 million patient records and other discrete clinical information amalgamated from 12 different source systems throughout the enterprise. The PDS uses standardized language from national coding systems including SNOMED, LOINC, and RxNORM; all data are being modeled in the OMOP data model.
Population Characteristics of Penn Medicine BioBank
| Genotype Chip | Exome Sequence | ||
|---|---|---|---|
| Total Patients | 19,515 | 10,900 | |
| Female (%) | 7856 (41%) | 4432 (40.7%) | |
| Median Age (at enrollment), yr | 66 | 67 | |
| Body mass index | 30.02 (13 - 83) | ||
| Race | European American | 11580 | 8198 |
| African American | 5988 | 2172 | |
| Ad Mixed American | 795 | 304 | |
| East Asian | 79 | 79 | |
| South East Asian | 114 | 114 | |
| Other | 575 | 33 | |
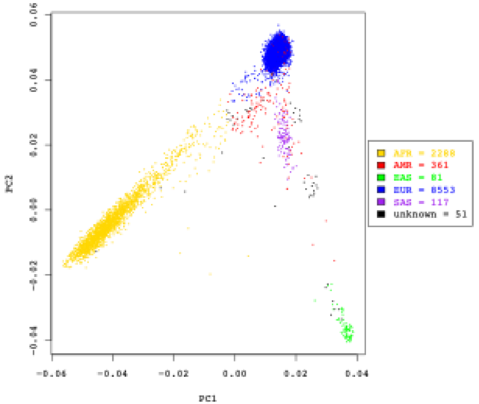
Here we show the first two principal components of ancestry, generated using common variants. Colors indicate ancestry groups. AFR = African; AMR = Native American, EAS = East Asian; EUR = European, SAS = South Asian

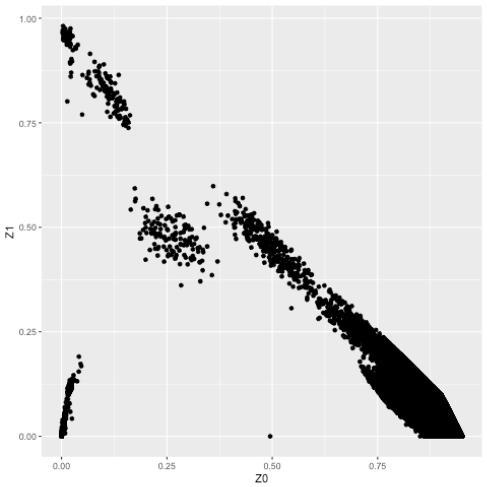
Relatedness between the individuals was estimated using identify-by-descent. We removed the related individuals with pi-hat threshold of 0.25 which account for relatives up-to first cousins.
